Your PLC traffic is stable until a camera recorder starts a scheduled transfer. The HMI then pauses and several video frames disappear, even though the switch datasheet lists a large backplane capacity. That symptom points to a traffic-path limit, not necessarily a fabric limit.
Check for one slow output port, many small packets, a short burst that exceeds the available queue, or a forwarding feature that was not active in the headline test. A Gbps figure alone cannot identify which boundary caused the interruption. To evaluate network switch performance, connect each datasheet figure to the traffic path it describes, then test that path under the conditions you intend to run.
Four specifications must be read together: network switch switching capacity describes the aggregate fabric boundary, network switch forwarding rate describes packet-processing demand, network switch uplink speed constrains a specific traffic path, and network switch buffers determine how much short-term congestion can be absorbed. None of these numbers alone proves application performance.
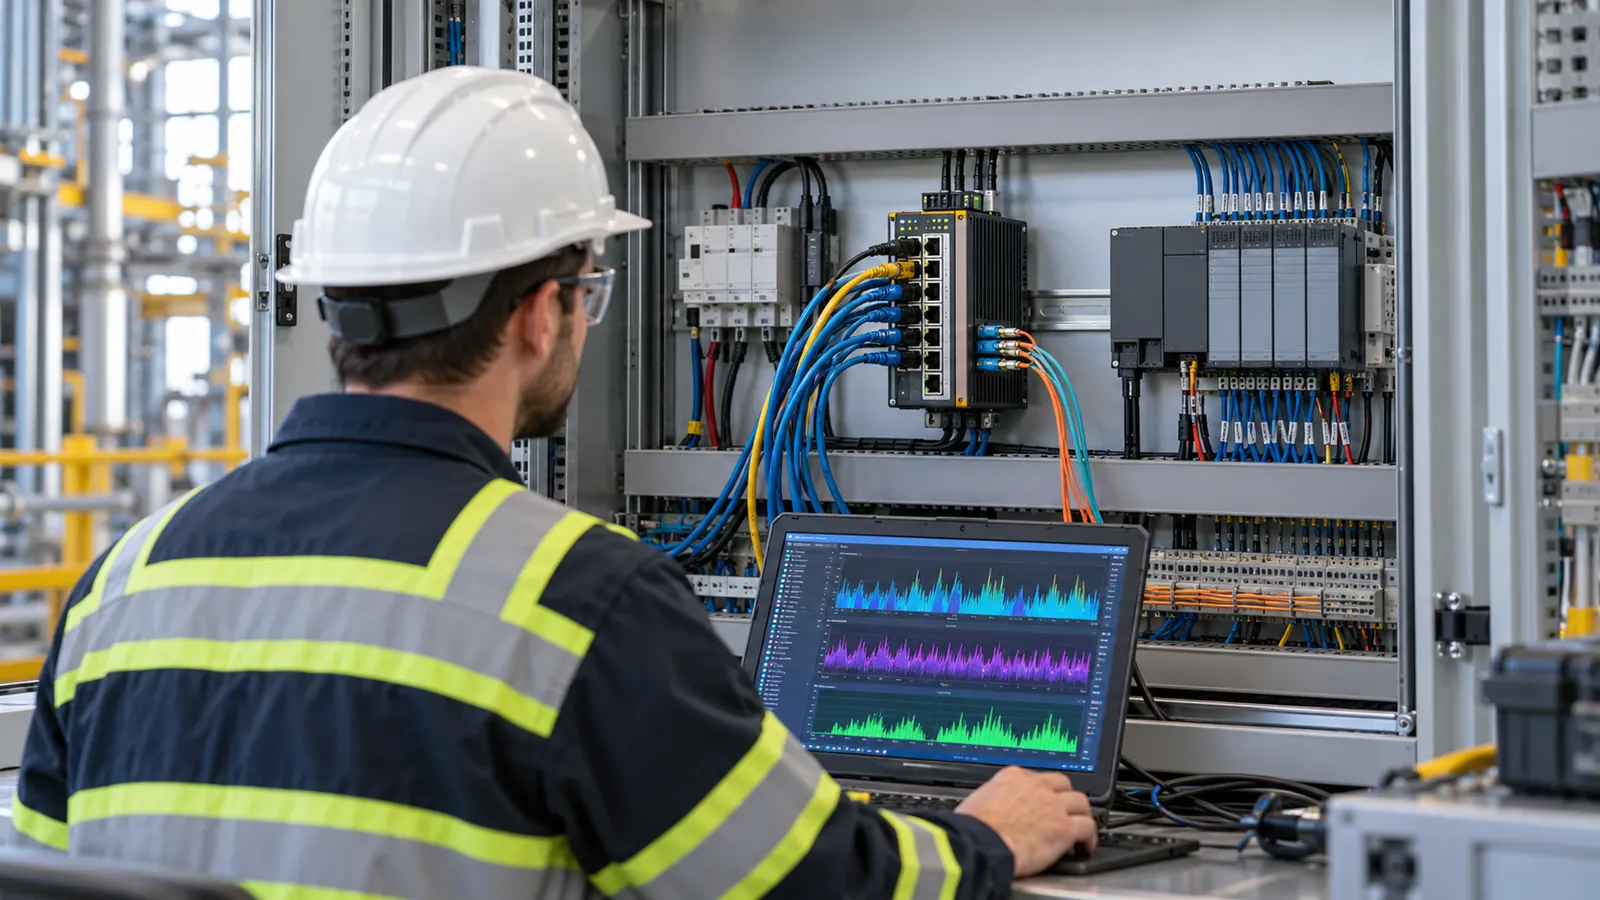
How switching capacity, forwarding rate, uplink speed and buffers shape network switch performance
Start at the point where traffic could queue or drop. These specifications describe different limits and should not be treated as one performance score.
| Your question | Relevant evidence | What the headline figure does Non lo fa prove |
|---|---|---|
| Can the switch fabric carry traffic among its ports? | Published switching/backplane capacity in Gbps, plus the vendor’s counting convention | That every port forwards every frame size without loss |
| Can it handle many small frames? | Published forwarding rate in Mpps with frame size, offered load and feature state | That a Gbps fabric value is an Mpps result |
| Can traffic leave through the intended path? | Active egress/uplink speed and simultaneous traffic to that port | That spare fabric capacity enlarges a 100 Mbps or 1 Gbps output |
| Can it absorb a short convergence burst? | Queue allocation, buffer behavior, congestion and frame-loss tests | That a total buffer figure is reserved for your one output port |
| Will your application remain stable? | Latency distribution, packet loss and recovery under your traffic mix | That a no-load ping or one vendor latency number covers peak operation |
If you first need to determine how many interfaces and what uplink speed to buy, use the separate industrial Ethernet switch port count and uplink bandwidth calculation. The decision here starts after that: does the shortlisted switch perform acceptably when those ports and features are actually in use?
Switching capacity vs forwarding rate: what is the difference?
Switching capacity and forwarding rate measure different limits. Switching capacity describes how many bits the switch fabric can move per second, while forwarding rate describes how many frames the switch can process per second. A switch can therefore show enough Gbps capacity for its port mix but still require an Mpps result to prove performance with small packets. Compare both figures under the vendor’s stated test conditions rather than treating either one as a complete performance score.
How to evaluate industrial Ethernet switch switching capacity
Industrial Ethernet switch switching capacity is normally given in Gbps and may also be called backplane bandwidth or switching bandwidth. Before comparing two models, check whether the figure is stated as one-way throughput or as the sum of transmit and receive directions. A common full-duplex screening formula is:
Required full-duplex switching capacity = sum of active port rates × 2
This formula is a design screen, not proof that the switch forwards every frame size at line rate with all required features enabled. The published capacity also needs to be compared with the actual port mix and the vendor’s counting convention.
Before accepting an industrial Ethernet switch switching-capacity figure, confirm its measurement scope:
- Does the total include every copper, SFP and SFP+ port, or only the access ports?
- Are stacking, expansion or dedicated uplink interfaces included in the figure?
- Is the number one-directional, or does it count transmit and receive capacity separately?
- Does your real traffic use all ports evenly, or does most of it converge on one uplink or destination?
An 8-port Gigabit switch may produce a 16 Gbps full-duplex port-sum screen, but that does not turn one 1 Gbps output into a 16 Gbps path. Aggregate fabric capacity and per-path capacity must be checked separately.
Network switch forwarding rate: why Mpps matters for small packets
Network switch forwarding rate is given in packets per second, often Mpps. Two traffic patterns can carry the same Mbps but place very different packet-processing demands on the switch. Minimum-size frames are especially useful for exposing that difference.
For a 64-byte Ethernet frame, the line also carries an 8-byte preamble/start-frame delimiter and a 12-byte interpacket gap. A one-direction 1 Gbps port therefore sees roughly 1.488 million minimum-size frames per second at line rate. That is a wire-rate calculation, not a switch benchmark. The underlying Ethernet framing relationship is described in Intel’s packet-rate discussion.
Frame size changes the packet-rate requirement dramatically. Using the same simplified wire-time calculation, a 1 Gbps link carrying 1518-byte Ethernet frames is approximately:
1,000,000,000 ÷ [(1518 + 8 + 12) × 8]
≈ 81,274 frames/s
≈ 0.0813 Mpps
The bandwidth is still 1 Gbps, but the switch processes far fewer frames per second than it does with 64-byte frames. Therefore, a large-frame throughput result cannot substitute for a minimum-frame forwarding-rate result. When comparing network switch forwarding rate, keep the frame size, port count, traffic direction, offered load and enabled functions consistent. If VLAN tags or another encapsulation change the frame size, record that condition and recalculate rather than copying the untagged value.
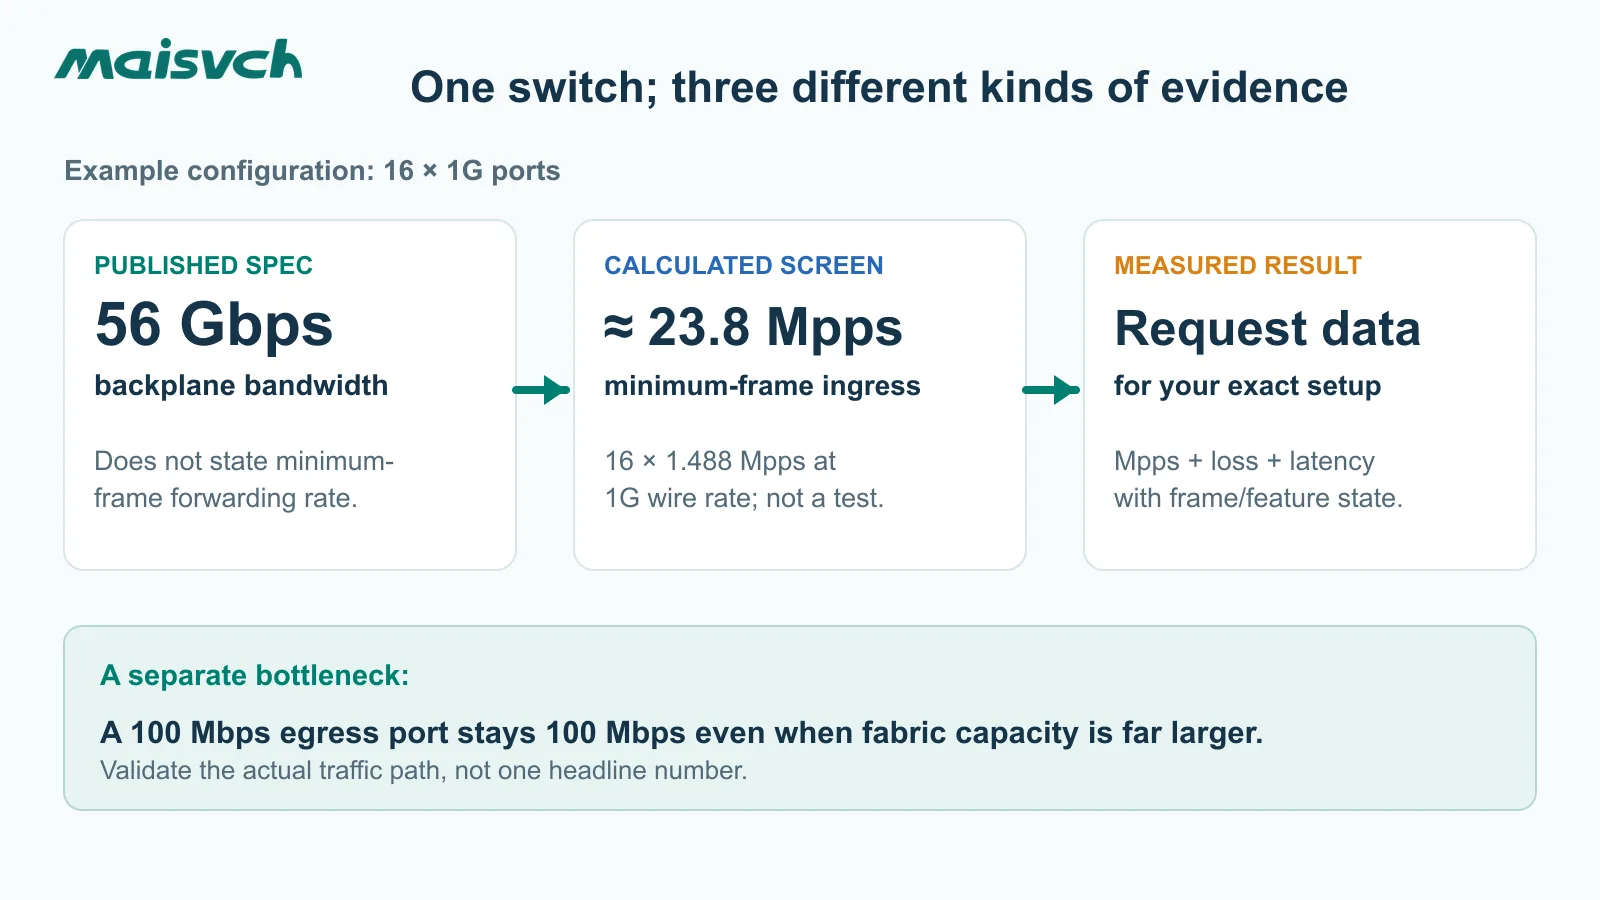
Consider the current 16-port managed industrial Ethernet switch MISCOM7216G-8GF-8GT. Its product page lists eight Gigabit SFP slots, eight Gigabit RJ45 ports, a 56 Gbps backplane and a 4.1 Mbit packet buffer. It does Non lo fa publish a packet-forwarding rate in Mpps on the page reviewed for this article. Under a simple full-duplex port-sum convention, 16 × 1 Gbps × 2 gives 32 Gbps. If all 16 ports were receiving minimum-size frames at 1 Gbps simultaneously, the theoretical aggregate input would be 16 × 1.488 ≈ 23.8 Mpps. Neither calculated number is a published Maisvch forwarding-rate measurement. The backplane figure also uses a vendor-specific accounting boundary that is not explained by that simple port sum.
That gives you three distinct entries for a comparison sheet:
| Entry | What to record for this example |
|---|---|
| Published product claim | 56 Gbps backplane; 4.1 Mbit total packet buffer |
| Calculated design screen | 32 Gbps full-duplex sum under the stated convention; about 23.8 Mpps aggregate minimum-frame ingress demand under the stated all-port scenario |
| Verified forwarding performance | Not published here; request a report for the exact model, firmware, frame sizes, traffic pattern and enabled functions |
These figures do not establish that the switch is too slow or unusually fast. They describe different boundaries. RFC 2889 therefore reports forwarding rate together with the offered load and test configuration for LAN switching devices.
Why network switch uplink speed and buffers can still cause packet loss
Network switch uplink speed is a per-path limit
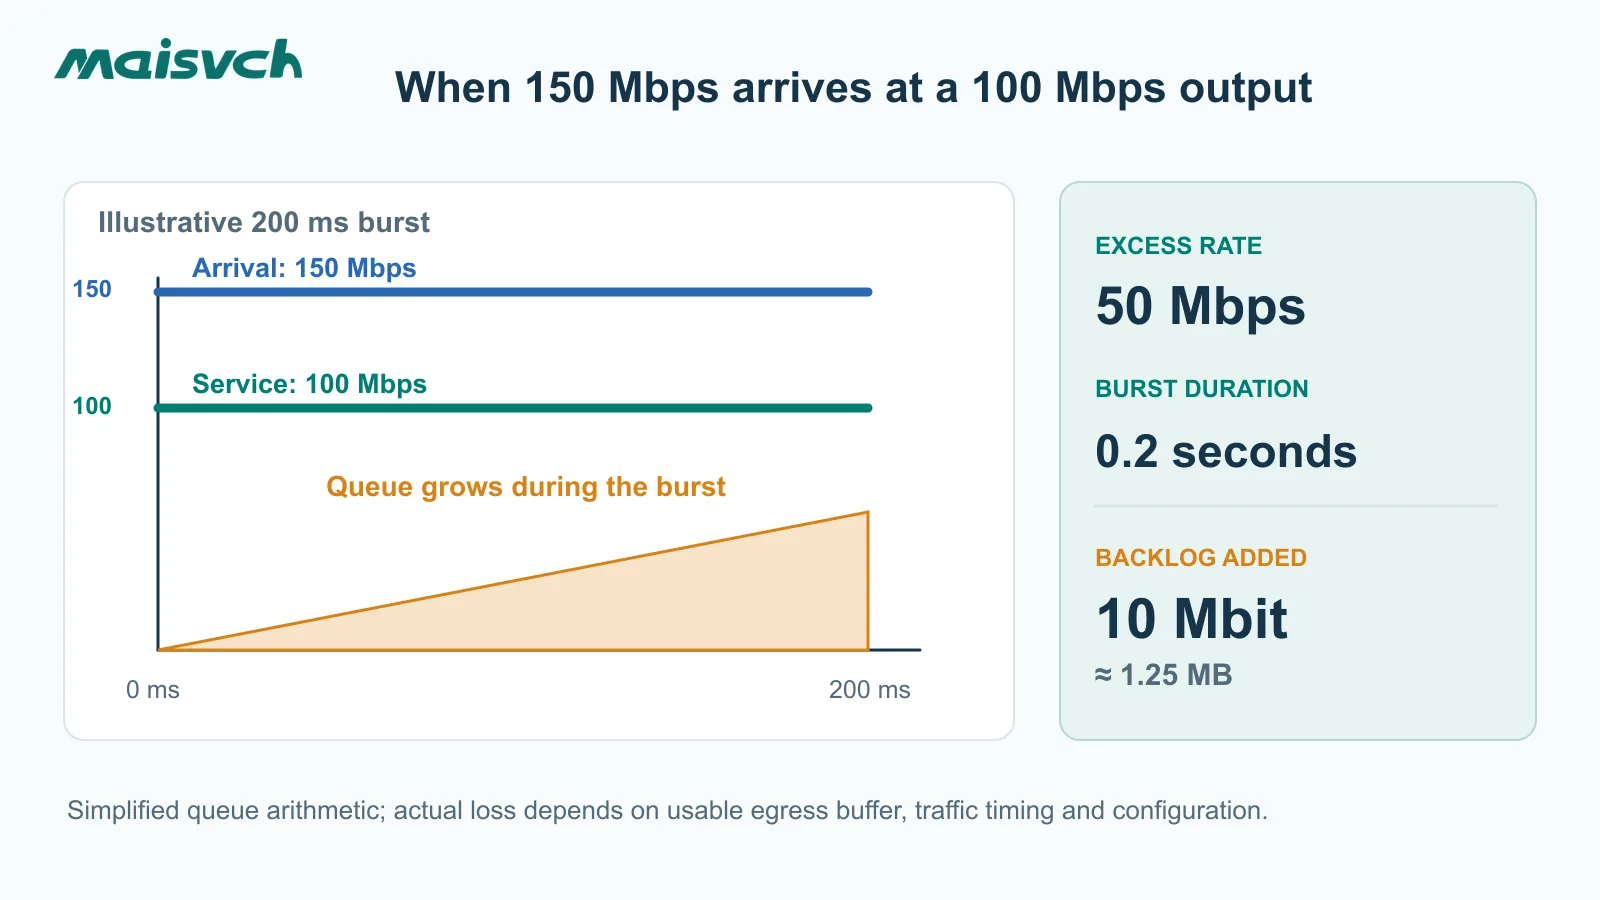
Frames must leave through a specific output port, so that port can become the bottleneck while the aggregate switch fabric still has unused capacity. Suppose traffic arriving for one 100 Mbps egress port briefly reaches 150 Mbps for 200 ms. Ignoring Ethernet overhead for this first-pass queue calculation:
Excess arrival rate = 150 − 100 = 50 Mbps
Backlog added over 0.2 s = 50 Mb/s × 0.2 s = 10 Mbit ≈ 1.25 MB
The same rule applies to a network switch uplink. Ten Gigabit access ports do not create 10 Gbps of usable throughput to the control room if their traffic converges on one 1 Gbps uplink. Compare the simultaneous traffic directed to that path — including traffic after a ring or uplink failure — with the negotiated uplink speed rather than with the switch’s aggregate fabric capacity.
Network switch buffers absorb bursts, not sustained overload
If that output’s usable queue space is smaller than the accumulated backlog, frames can be dropped or delayed unless the sources are shaped, traffic is paused, or the burst changes. This does Non lo fa assert that a particular Maisvch switch will lose packets in this scenario. Your actual result depends on network switch buffer allocation, other ports, queue policy, flow control and the traffic’s timing.
A datasheet’s total buffer size is not a per-port guarantee. A shared buffer may be divided dynamically, and QoS classes may have different queue limits. If you want the definition and common buffer architectures, the existing buffer dello switch di rete article covers that foundation. For this purchase, ask how much burst the relevant egress queue can survive with your configuration and confirm it in a congestion test.
A larger buffer may reduce packet loss during a short burst, but queued frames must wait. As queue occupancy rises, latency and latency variation can rise as well. For cyclic control traffic, it is therefore not enough to record only whether packets were lost. Measure queueing delay and jitter while the competing traffic is present. QoS can decide which class is served first, but it cannot increase the physical output rate or guarantee that a poorly sized uplink never congests.
Check the path before blaming the buffer
When a site reports slow traffic, examine the evidence in this order:
- Link and error state: negotiated speed/duplex, CRC or FCS errors, optical alarms and cable or connector faults. A 1 Gbps design running at 100 Mbps changes the entire bottleneck calculation.
- Per-port utilization and drops: observe ingress and, especially, the egress port used by the affected flow. Short peaks can be invisible in five-minute averages; use finer-grained counters or a traffic capture when needed.
- Traffic convergence: identify every source that sends to that egress during the problem period, including multicast replication, cameras, APs, backups and engineering downloads.
- Configured behavior: inspect rate limits, storm control, QoS trust and queue rules, pause frames, VLAN paths and any ACL or routing features on the forwarding path.
- Application effect: correlate switch counters with camera gaps, PLC communication alarms and HMI timeouts. A clean ping under light load does not isolate switch forwarding latency during a burst.
If your network is resilient, repeat the traffic-path check after a ring or uplink failure. The surviving path may be narrower even though the normal-state test passed.
Which industrial traffic patterns expose network switch performance limits?
Your test should reproduce how traffic arrives, not just the average Mbps shown on a monitoring dashboard. Three industrial patterns can stress different parts of the same switch:
| Application pattern | Hidden performance risk | What you should verify |
|---|---|---|
| Synchronized machine-vision capture | Several cameras transmit image bursts at nearly the same time; the average rate may look moderate while the instantaneous receiver or uplink demand is high | Trigger timing, peak burst size, receiving-port capacity, usable queue space, frame loss and image completeness |
| Multi-camera video aggregation | Many variable-bitrate streams converge toward one recorder or monitoring uplink; scene changes can raise several stream rates together | Aggregate peak bitrate, uplink headroom, multicast behavior if used, output drops and performance after a link failure |
| PLC/control traffic mixed with video or backups | Small cyclic control frames compete with large best-effort frames for the same egress path | Per-class queue behavior, control-message latency and jitter, lower-priority loss, QoS configuration and application response |
A generic “Gigabit” label or a no-load ping cannot qualify the switch for these three traffic patterns. Define the sources, destinations, frame sizes, cycles, bursts and concurrency first; then match the switching-capacity, forwarding-rate, uplink and buffer tests to that traffic model.
How should you test network switch performance before approval?
Ask for an isolated laboratory or factory acceptance test (FAT), not an overload experiment on the running plant. RFC 2544 provides throughput, latency, frame-loss and burst-test methods for network interconnect devices; RFC 2889 adds LAN-switch traffic patterns such as many-to-one forwarding and congestion. RFC 9004 updates the back-to-back burst method. RFC 6815 warns against applying disruptive RFC 2544 tests to production networks carrying live users.
Give the test team a specification they can reproduce. You can copy this matrix into your RFQ or FAT plan:
| Record before the test | Your project value / requested evidence |
|---|---|
| Exact switch order code and datasheet revision | __________ |
| Firmware version and active functions | VLAN, QoS, IGMP snooping, ACL, routing, redundancy, timestamping or other features actually required |
| Port/optic layout | Source ports, destination ports, SFP models, negotiated speeds and directions |
| Traffic pattern | One-to-one, fully meshed, many-to-one, multicast replication and normal/failure path as applicable |
| Frame sizes | At minimum a small-frame case and the frames representative of your application; document any RFC 2544 series used |
| Offered load and burst profile | Sustained rate, burst rate, duration, inter-burst gap and background traffic |
| Conditions | Supply voltage, ambient temperature, cable/optic setup and measurement equipment |
| Results to retain | Offered and forwarded packets, loss, latency distribution, egress/queue counters and back-to-back burst result |
| Acceptance limits | Your specified maximum loss and latency/variation under the stated load; separately record failover recovery target if required |
Do not ask for a universal “zero latency” or a guaranteed buffer size from a generic datasheet. Ask the supplier to report the measured result, equipment, topology and conditions that correspond to your actual requirement. For short control packets, include a small-frame test. For camera and backup traffic, include your realistic larger-frame mix and convergence pattern. If QoS is needed to protect PLC traffic, run the test with the production QoS configuration enabled and also document what happens to lower-priority traffic under congestion. QoS can choose which queue receives service; it cannot create more output bandwidth.
Keep a benchmark separate from an application acceptance test
A clean RFC-style benchmark measures the switch under a defined laboratory traffic pattern. A commissioning test determines whether the whole application remains usable with its actual PLCs, I/O devices, cameras, APs, optics and recovery behavior. Use the benchmark as the switch baseline, then observe application errors, switch counters and traffic while the intended functions run together. Do not intentionally saturate a live production network merely to obtain a marketing number.
What can Maisvch verify for your shortlist?
For a mixed copper/fiber access cabinet, the published MISCOM7216G-8GF-8GT data gives you port mix, 56 Gbps backplane capacity and 4.1 Mbit total buffer. For a design requiring 10G aggregation and time-sensitive functions, the industrial TSN switch MISCOM8216TSN-4XGF-4GF-8GT page lists four 10G SFP+ ports, four Gigabit SFP ports, eight Gigabit RJ45 ports, a 180 Gbps backplane and a 32 Mbit buffer. These are different port mixes and feature sets, not an efficiency ranking. Neither quoted page provides the Mpps or queue-specific burst result needed to sign off your application from a table alone.
Use the managed industrial Ethernet switches category to shortlist by required interfaces and functions. Then send Maisvch your topology, source-to-destination traffic, frame-size mix, peak and burst profile, active QoS/multicast/redundancy functions, environmental conditions and acceptance limits. Ask which exact model and firmware can be tested, what result can be documented and which figures remain datasheet claims. That gives your engineering and procurement teams a basis for a model decision without inventing performance assurances.
Network switch performance FAQ
Can an Ethernet switch slow down your network?
Yes, if a link negotiates below the required speed, traffic converges on a narrower output, or the switch drops or queues frames under the actual load. Check port errors, negotiated speeds and egress counters before deciding that the switch fabric itself is the cause.
Does a higher switching capacity guarantee lower latency?
No. Switching capacity is an aggregate fabric figure under the vendor’s stated convention. Port speed, queueing, packet size, feature configuration and congestion determine the latency experienced by a particular flow. Compare latency only when the test conditions match.
How much switching capacity does an industrial Ethernet switch need?
Add the rates of the ports that may be active simultaneously and multiply by two when the datasheet uses a full-duplex counting convention. Then compare that requirement with the published industrial Ethernet switch switching capacity. This is only the first screen: you still need a relevant forwarding-rate result and a test of the actual traffic path, enabled features and failure state.
How do you choose the right network switch uplink speed?
Build a source-to-destination traffic matrix and total the peak traffic that can converge on each uplink. Include multicast replication, camera bursts, engineering downloads and the traffic that moves to the surviving link after redundancy failover. Choose the uplink speed and oversubscription ratio from that path demand, then validate the design under the expected burst pattern.
Is packet-forwarding rate more important than bandwidth?
Neither metric is universally more important. Many small control frames can demand a high packet rate at modest Mbps, while large video or file-transfer frames may stress output bandwidth more strongly. Compare both metrics with the intended traffic profile and an Mpps result measured under relevant conditions.
Can a large-frame throughput test prove small-packet forwarding performance?
No. At the same 1 Gbps line rate, 64-byte frames require about 1.488 Mpps, while 1518-byte frames require only about 0.0813 Mpps under the stated wire-time calculation. A large-frame test can validate bandwidth handling, but it does not impose the same packet-processing demand. Ask for the frame sizes and conditions used in every forwarding-rate result.
Will a bigger packet buffer prevent all packet loss?
No. A finite buffer can absorb only a finite excess burst. It cannot sustain a long-term input rate above the output’s service rate. Queue allocation and QoS policy also affect which flow waits or drops.
Can I benchmark the switch on the live plant network?
Do not run disruptive overload tests on production traffic. Use an isolated lab or FAT for RFC-style benchmarking, and perform a separately controlled application acceptance test during commissioning. Define safe loads and change controls for any production observation.